One of the big goals of the GNOME 3 Shell is to use animation and visual effects for positive good. An animation explains to the user what the connection is between point A and point B. For this to work, the animation has to be smooth – it can’t be a jerky sequence of disconnected frames. Performance matters.
Over the last 18 months we’ve done a fair bit of work on performance – everything from fixing problems with AGP memory caching in the radeon kernel drivers to to moving tests for whether recent files are still there to a separate thread. But this work was ad-hoc and unsystematic. There was no way to see if shell performance got better or worse over time. To compare the performance of two different systems. Or even to tell in a rigorous way whether an optimization that seemed to make sense actual improved things. Over the last few weeks I’ve been working to correct this; to get hard, repeatable numbers that represent how well the shell is performing.
The core of the GNOME Shell performance framework is the event log. When event logging is enabled, all sorts of different types of events are logged: when painting of a frame begins, when painting of a frame ends, when the user enters the overview, and so forth. The log is stored in a compact format (as little as 6 bytes per event), so can be recorded with very little overhead. It doesn’t significantly affect performance.
The other thing that is recorded in the event log is statistics. A statistic is some measurement about the current state: for example, how many bytes of memory have been allocated. Every few seconds, registered statistics are polled and written to the event log as a special event type. Statistics collection can also be triggered manually.
Once we have an event log recorded, we can analyze it to determine metrics. We can measure the latency between clicking on the activities overview button and the first frame of the zoom animation. We can see how many bytes are leaked each time the user goes to the overview by comparing the memory usage before and after. Since we want to measure exactly the same conditions every time, we don’t want to analyze a performance log generated by the user actually doing stuff; instead we script the operation of the shell from Javascript. You can see how this looks by looking at the run() function in js/perf/core.js. The rest of this performance script contains the logic to compute the metrics when the recorded event log is replayed (For example, during replay the script_overviewShowDone() function is called when replaying a script.overviewShowDone event.)
Running gnome-shell --replace --perf=core produces a summary of the computed metrics that looks, in part, like:
# Additional malloc'ed bytes the second time the overview is shown

leakedAfterOverview 83200

# Time to first frame after triggering overview, first time

overviewLatencyFirst 192482

# Time to first frame after triggering overview, second time

overviewLatencySubsequent 66838
(The times are in microseconds.) Being able to get these numbers for a particular build of the shell is good, but what we really want to be able to do is compare these numbers over lots of systems over time. So, there’s also a website shell-perf.gnome.org where statistics can be uploaded.
(The way that uploading works is that after registering a system on the site, you are mailed instructions about how to create a ~/.config/gnome-shell/perf.ini with an appropriate secret key, and the --perf-upload option uploads the report. Please only do this with Git builds of gnome-shell for now – there are some updates to the metrics even since the 2.29.2 release yesterday.)
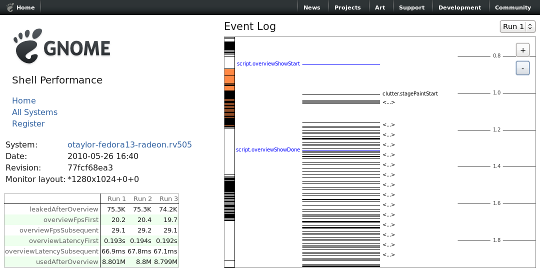
If you browse around the site, you’ll see that you can look at the recorded metrics for different systems or for an individual system over time. You can also look at a specific uploaded report. An example:
I should point out, since it’s not very obvious, that navigation to individual reports is by clicking on the report headers in the system view. In the report view, you can see the details of the uploaded metrics. But you also can see the entire original event log! (The event log browser is using the HTML canvas – I’ve tested it in Firefox and Epiphany – it probably works in most browsers that GNOME developers are likely to be using.) Having the event log means that if an anomalous performance report is uploaded we can actually dig in and see more about what’s going on.
